GSoC 2021: Polaris Web Reports
A tool to generate customizable and rich analysis Reports and make interactive graphs

Purpose
Polaris is an open-source CLI based satellite telemetry analysis tool under Libre Space Foundation umbrella which uses machine learning techniques to satellite data.
The purpose of my GSoC project was to make two new module commands:
Polaris BehaveThe first goal was to make a module which uses a pre-built autoencoder model fromBETSI libraryand detect anomalies in satellite telemetry data and output the results, models, history and normalizers in nicely formatted form.Polaris ReportThe second goal was to use the results ofPolaris behaveand show them in the interactive formats in a web browser so that users can read them more easily.
Demo
There is no better way of understanding the project than look and feel on your own. You can look at the demo analysis yourself at https://librespacefoundation.gitlab.io/polaris/polaris-reports/
Here are some of the report sections for you:
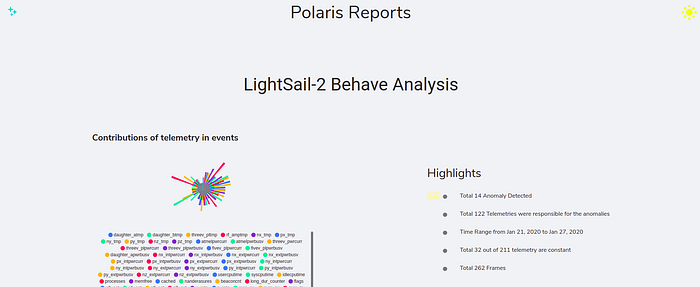
Contribution Graph:

The contribution graph is made by counting the number of events that are common in individual telemetry and the overall events. That gives the idea of the number of events in which one telemetry contributed.
Highlights

The highlight section shows the summary of the input data such as the number of telemetries, input date range, number of frames captured etc.
Stacked Graph of telemetry with Anomalies shown as annotations

Compare Individual Telemetry Graphs side by side
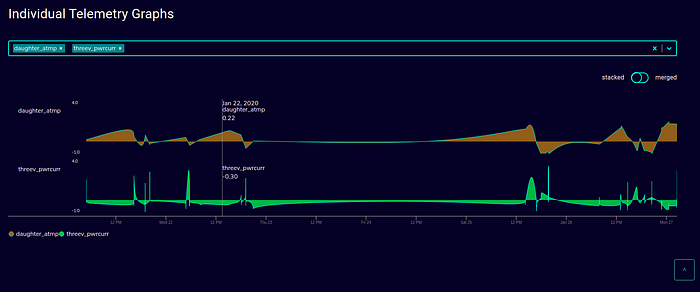
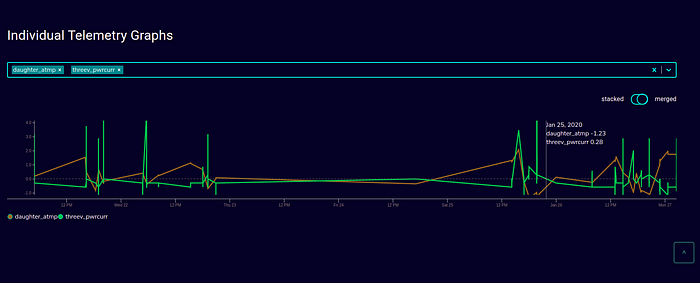
Compare Individual Telemetry Graph on Single Plot
Support For Both Light and Dark Themes
Work
Here is the link to my GSoC proposal if someone wants to look at my original plan: https://docs.google.com/document/d/14VSv9-pJX3n-a731eAu89w9OchMbIz7fQmFr_2hqxIA/edit?usp=sharing
I learnt a whole bunch of new things during this time. Some of them are:
- I learnt the importance of unit and integration tests. I made test cases for several classes and modules in Polaris.
- I tried out a lot of charting and graph libraries to select the perfect library that was able to handle big data, aesthetically beautiful and future proof.
- I learnt a whole lot about machine learning and auto-encoders. I read a bunch of research papers about anomaly detection, feature importance detection and other stuff.
- I got to know about how important the description of the merge request is when you are working with the collaboration of others. I started to write clearer descriptions, workflow of the merge requests, proof of validation and results in the description for better understanding.
For the more detailed flow of work and list of MRs you can refer to this Sheet: https://docs.google.com/spreadsheets/d/1mXaSVNNzrboe82cDyAZ-5tLqAFd6EMmkqpBgScFfhV4/edit?usp=sharing
Future Work
Polaris Web Reports is just born, and there is a world of things to do in it. Some major things are:
- Make Supports for Multi-Satellite by URL separation.
- Improve look and feel and responsiveness of the reports.
- Integrate
Polaris dependency graphin it to unify the visualization process. - Use Graph Comparison to get information of telemetry responsible for an anomaly, percentage of responsibility of telemetry, order of importance of telemetry in an anomaly and other micro details.
- Add Support for both normalized graph and un-normalized graph.
More than Just an Internship
I want to thank the whole Libre Space Foundation and Polaris community for always helping me out with the comprehension of the entire ecosystem. Despite these people’s various engagements, they were responsive, which helped me get my doubts cleared as soon as possible.
It was a great summer working on this project, and now I am pretty familiar with Polaris development. I would continue to contribute by writing code or encouraging people to do so by reviewing their MR and explaining to them the concepts involved in the project. GSoC is not the end.